TL;DR
BlueHound is a new open-source tool from Zero Networks that helps blue teams pinpoint the security issues that actually matter. By combining information about user permissions, network access and unpatched vulnerabilities, BlueHound reveals the paths attackers would take if they were inside your network. It is a fork of NeoDash, reimagined, to make it suitable for defensive security purposes.
The tool can either be downloaded as a binary, built from the source code, or used as part of the ROST iso (download here). You will also need a Neo4j database ready if you are not running it from the iso image.
Intro: From Red Heavens to Blue Hells
The adoption of graph algorithms by adversaries - whether simulated during red team engagements or real ones - with tools such as BloodHound, has widened the gap between attackers and defenders. While attackers are enjoying this “red heaven” – where finding attack paths is simpler than ever – for defenders this has translated into a “blue hell”.
To get out of this mess, blue teams need a companion. A tool that helps them collect information, visualize it and assist in prioritizing mitigations. This trustworthy companion is BlueHound.
Red Heaven
Back in 2016, roughly 22,000 people attended Defcon 24, cramming the halls of the Caesars Palace hotel, rushing between various security tracks. Ushers were yelling out directions and names of the upcoming tracks, trying to direct the massive waves of badge wearing nerds to their desired lecture halls. Popular tracks were filling up quickly, and people had to sit on the floor or resort to leaning against the back walls to get a chance to hear the speakers.
One of the most packed tracks of that year was definitely Six Degrees of Domain Admin – Using Graph Theory to Accelerate Red Team Operations. @_wald0, @CptJesus, and @harmj0y demonstrated how graph theory can be used to discover attack paths inside a domain environment, using a tool called BloodHound. This was a collective “a-ha” moment for the entire industry. For the average red-teamer this meant heaven: a complex domain environment is elegantly transformed into an easy to understand “map”. All a red teamer had to do was pick which path they want to take to achieve their goal.
The concept of using graph theory to find exploitable paths in complex environments have since been replicated in many other tools: AzureHound, adalanche, cartography, gcphound, awspx and many more.
Blue Hells
While red-teams were using tools such as BloodHound to cut through organizations like butter, blue-teams were left to fill up the holes that the power of graph theory had uncovered in their environments. This is no easy task. Attackers only need to follow one path to succeed, while defenders need to defend against all possible paths. This is a daunting endeavor. Even in relatively small environments, there could be literally millions of paths.

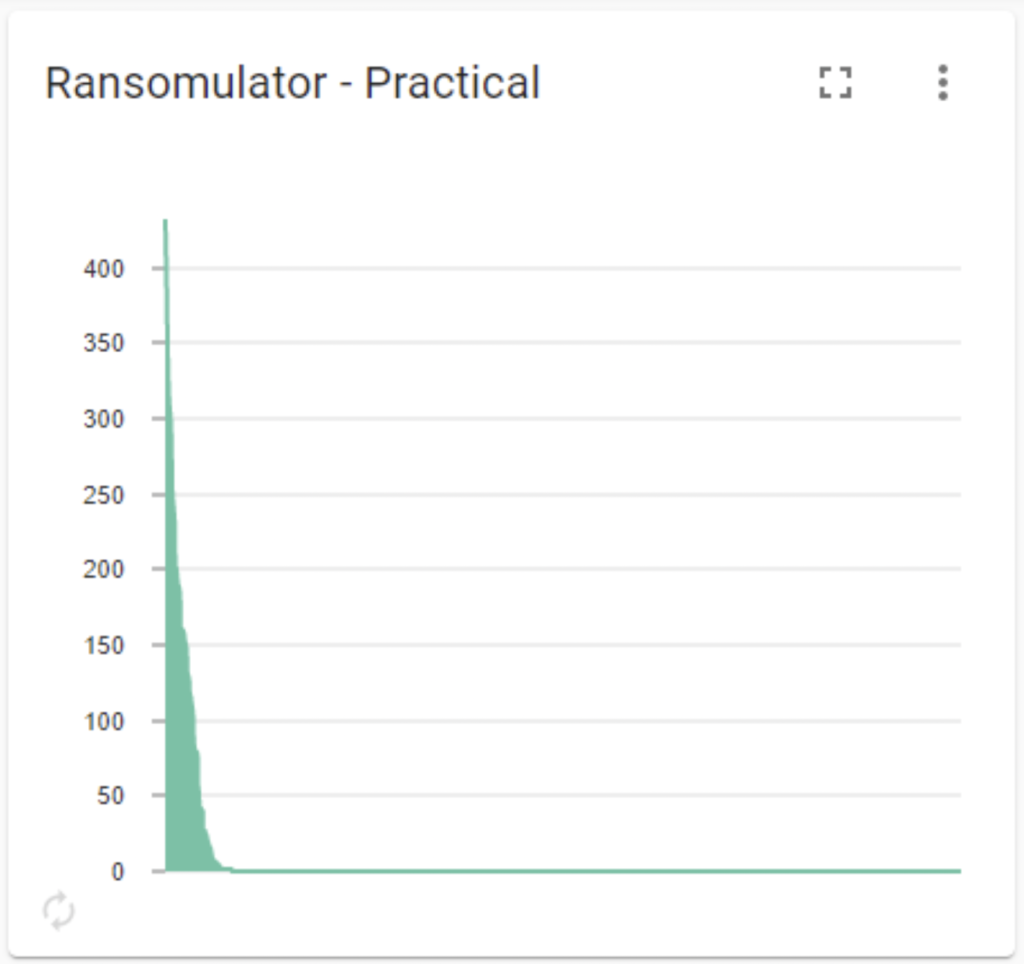
There are several approaches to help the poor blue teamer meet this challenge:: from Cypher queries they can run in their environment to help them identify dangerous paths, to tools that enable them to generate and share reports (such as PlumHound and Ransomulator). Additionally, there are resilience guides such as this one and this one that help train blue teams in methodologies aimed at developing better resilience.
Even with all this support, there are still very big hurdles to overcome when trying to implement a resilience program:
- No automation: there are tools that collect data (such as SharpHound), there are tools that analyze it (such as BloodHound) and then there are tools that report on it (such as PlumHound). However, there is no single tool that can perform the entire cycle of collection, analysis, and reporting.
- Lack of Community Support: When trying to figure out best practices for building better resilience, most resort to various blogs, guides, or slack channels. There is no platform that blue-teamers use that has information sharing built-in.
- Complex reporting: attackers think in graphs, defenders in lists, and managers in pie charts. There is no simple way to take complex data and generate tailored reports designated for a specific consumer. Especially because each consumer likes to receive their data in a certain way.
- Customization is hard: even though many security tools are open source, they are designed to solve a specific problem. Tailoring the solution to your environment is not always easy. Therefore you find numerous “satellite” tools that aim to solve specific use cases around the same dataset (such as crackhound) or tools that aim to solve a similar problem, but for a different dataset (such as adalanche).
The BlueHound Approach
To tackle all these issues, we developed BlueHound. Originally inspired and forked from neodash(a neo4j dashboard builder): BlueHound heavily expands neodash to make it suitable for defensive purposes. At its core, the project is developed using TypeScript, with React for the frontend, Node.js as the backend, and bundled into a desktop application using Electron.
It is an open-source tool that helps blue teams automate, report, customize and share the graph datasets in an intuitive manner, without the need to write any code.
BlueHound essentially answers all the challenges discussed:
- Full Automation: The entire cycle of collection, analysis and reporting is basically done with a click of a button.
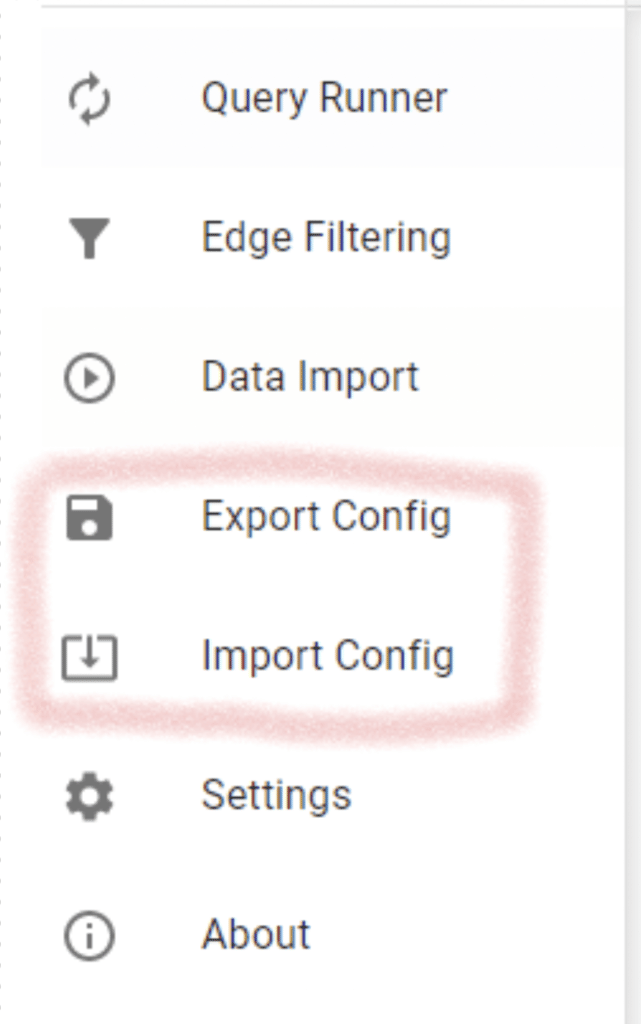
- Community Driven: BlueHound configuration can be exported and imported by others. Sharing of knowledge, best practices, collection methodologies and more are built-into the tool itself.
- Easy Reporting: Creating customized reports can be done intuitively, without the need to write any code.
- Easy Customization: Any custom collection method can be added into BlueHound. Users can even add their own custom parameters or custom icons for their graphs.
Showing by Example
There are truly innumerable use cases for BlueHound. To paint a clearer picture for the reader of how BlueHound can be utilized to solve real world issues, we will share a “running” use case of a fictional blue team member Jamie in OREZ Corp.
Streamline Collection Efforts
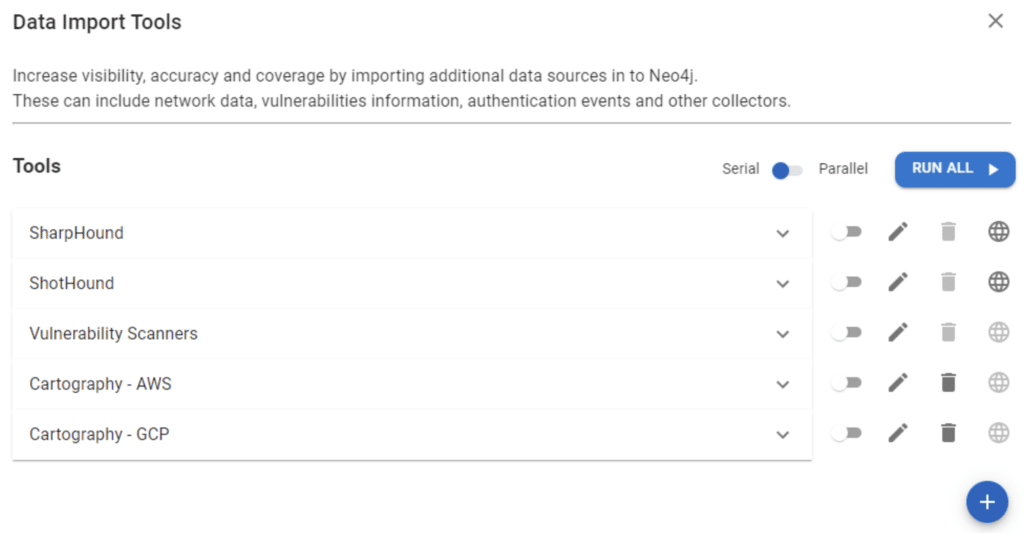
Before Jamie can assess OREZ Corp’s security posture, he needs to collect information from various sources. He does so routinely with several open source tools including: SharpHound and ShotHound for the on-prem environment. Cartography and AzureHound for GCP and Azure. And finally, Jamie routinely generates a vulnerability report via Nessus.
While some of these tools push data directly into Neo4j, this is not always the case. For example, SharpHound requires manually dragging and dropping the results file into BloodHound for them to be entered into Neo4j. Nessus reports are not pushed into Neo4j at all.
BlueHound automates data collection using the Data Import Tools pane. Jamie can streamline data collection from multiple sources, including SharpHound, AzureHound and even Vulnerability scanners such as Nessus. Once clicking “RUN ALL”, the tools will start collecting data and ingesting it into Neo4j database.

Customization Per Environment
Once all the data is sitting comfortably inside the Neo4j database, Jamie is ready to query the data from all different angles. Jamie’s environment, just like any other, is unique. Therefore, it requires some customization.
Jamie uses parameters to store information specific to his environment. For example, he selects the specific domain controllers, domain admins and crown jewel hosts in his on prem environment.

Network Enabled Paths
Once Jamie finishes customizing BlueHound for his needs, he can execute all the charts in his report. This produces a wealth of information, some in graphical form, other in tables or line charts.
One of the things Jamie is interested in is seeing the network enabled paths that are available in his network. This is the result of collecting information using SharpHound and validating paths using ShotHound. This gives Jamie clearer priorities on which paths need to be dealt with first.

Measuring Resilience
Graphs and charts are great and all. But at the end of the day, Jamie needs to report to management about their security posture: is it getting better or worse? For this, Jamie needs some hard numbers. Before using BlueHound, Jamie needed to take results from multiple locations and crunch their numbers in excel to measure resilience.
Using BlueHound, Jamie can now get his resilience measurements directly in the report, based on network access data (as described here):

Running Ransomulator
BlueHound includes a special type of chart, called Ransomulator. This chart simulates how a ransomware-like infection can spread in your on-prem environment. Jamie can then use this data to tailor his mitigation efforts to specific users / hosts that can infect large portions of his environment.

Sharing is Caring
Jamie can export his report to share with other security professionals, so they can run the same measurements and reports in their environment. This benefits Jamie and the entire community, as BlueHound enables them to continuously improve their reports, share best practices, fix bugs, and more.

Try it Out
If you want your “blue hell” to become a blue haven, BlueHound is the tool for you.
Our new open-source tool helps blue teams pinpoint the security issues that actually matter. By combining information about user permissions, network access and unpatched vulnerabilities, BlueHound reveals the paths attackers would take if they were inside your network.
To get started with BlueHound, check out our introductory video here, and download your copy at https://github.com/zeronetworks/BlueHound.


